Create and Use the Histogram
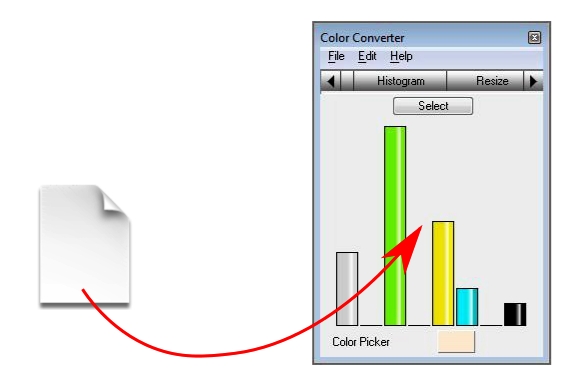
To create a histogram, drag a picture file into the Histogram tab of Color Converter. The histogram will be created automatically.You can also click on the Select button and select any area of your main screen.
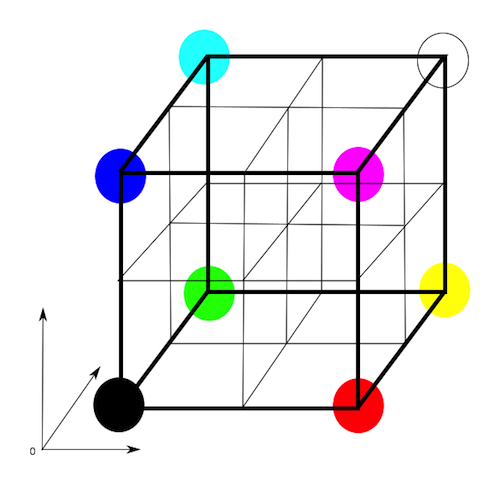
The histogram is created by examining a sample of the pixels of a picture. The RGB values are projected in the cube below. Since RGB values contain three values, one for red, one for green and one for blue, the pixels can be ordered along the axes of the cube. The result is a cloud of points inside the cube.
The cube is divided into 8 areas. Each area is tangent with one of the following colours: black, red, green, blue, cyan, magenta, yellow, and white. Now we count the number of points in each area. The resulting numbers are depicted in the histogram.
From the histogram, you can read which colours dominate your picture. Sometimes, a picture may seem mostly yellow but actually appears to be more green. This can have many causes, such as the colour profile being used, your screen settings, or a form of visual deception. Colour blindness may have an effect too --not all forms of colour blindness are always recognised as such!
When you know which colours dominate your picture, you can decide which pictures may match the picture to create a collection that's pleasing to the eye, or you can decide on the colours for your web design.


